





in economic losses from climate disasters every year. Extreme weather events are now a major risk for companies, regions and investors.
Stop absorbing climate risk. Turn it into a decision-making lever.
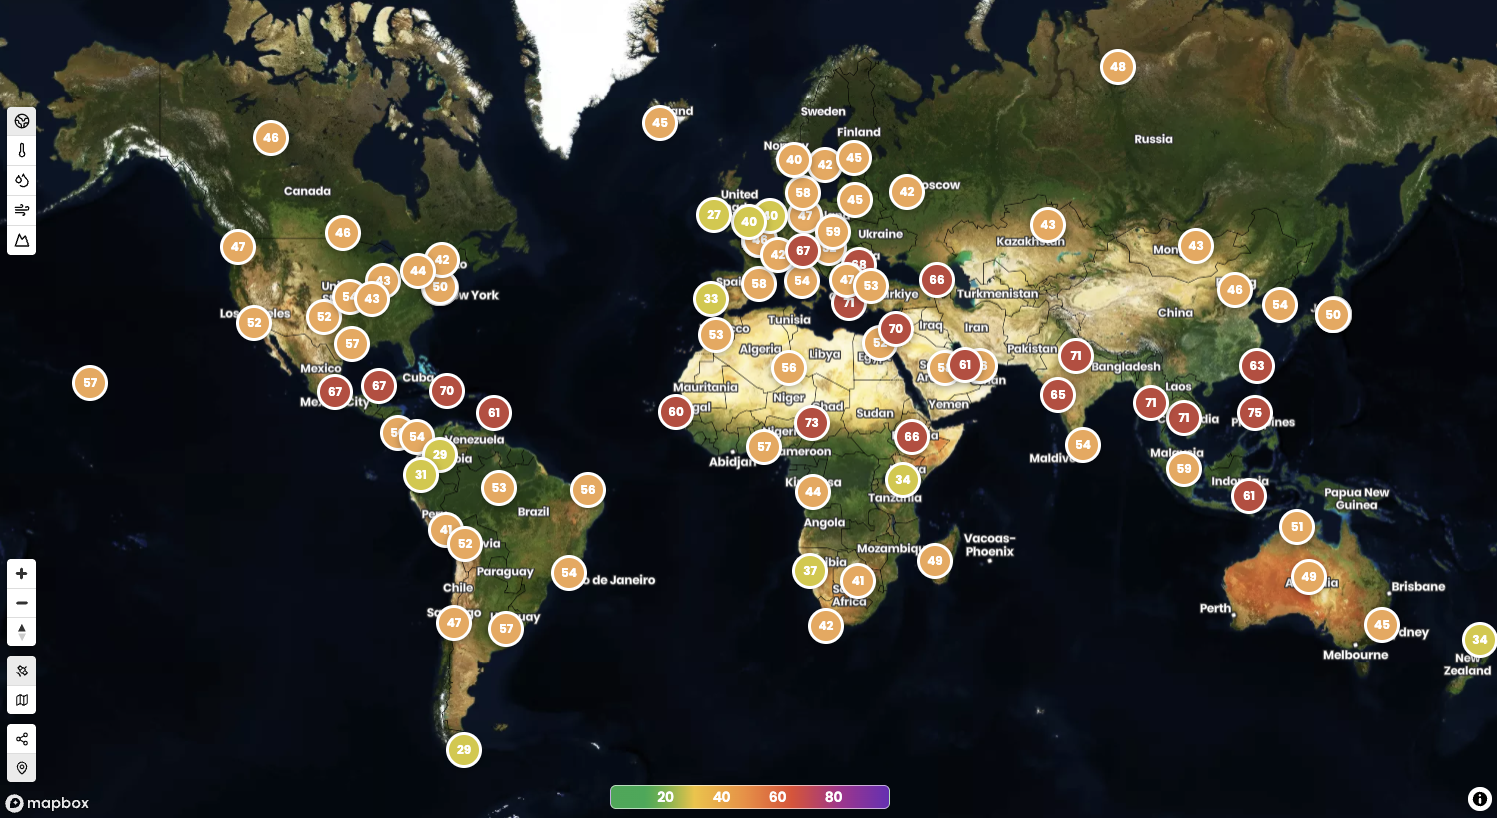
CSRD and IFRS S2 require you to assess your assets' climate exposure. Climate Pacer goes further: precise, auditable scores across 32 hazards, 5 time horizons and 3 IPCC scenarios — to report, but above all to decide.
Overall exposure index
0
/ 100
High
Horizon 2075 · Scenario SSP4.5
Aligned with the standards and frameworks:
The Climate Pacer platform
Today the platform measures each asset's exposure: where it sits, to which hazards, over which horizons. Physical risk will come next, combining that exposure with the asset's own vulnerability, then climate Value at Risk (VaR), which translates it into an expected cost.
-
01
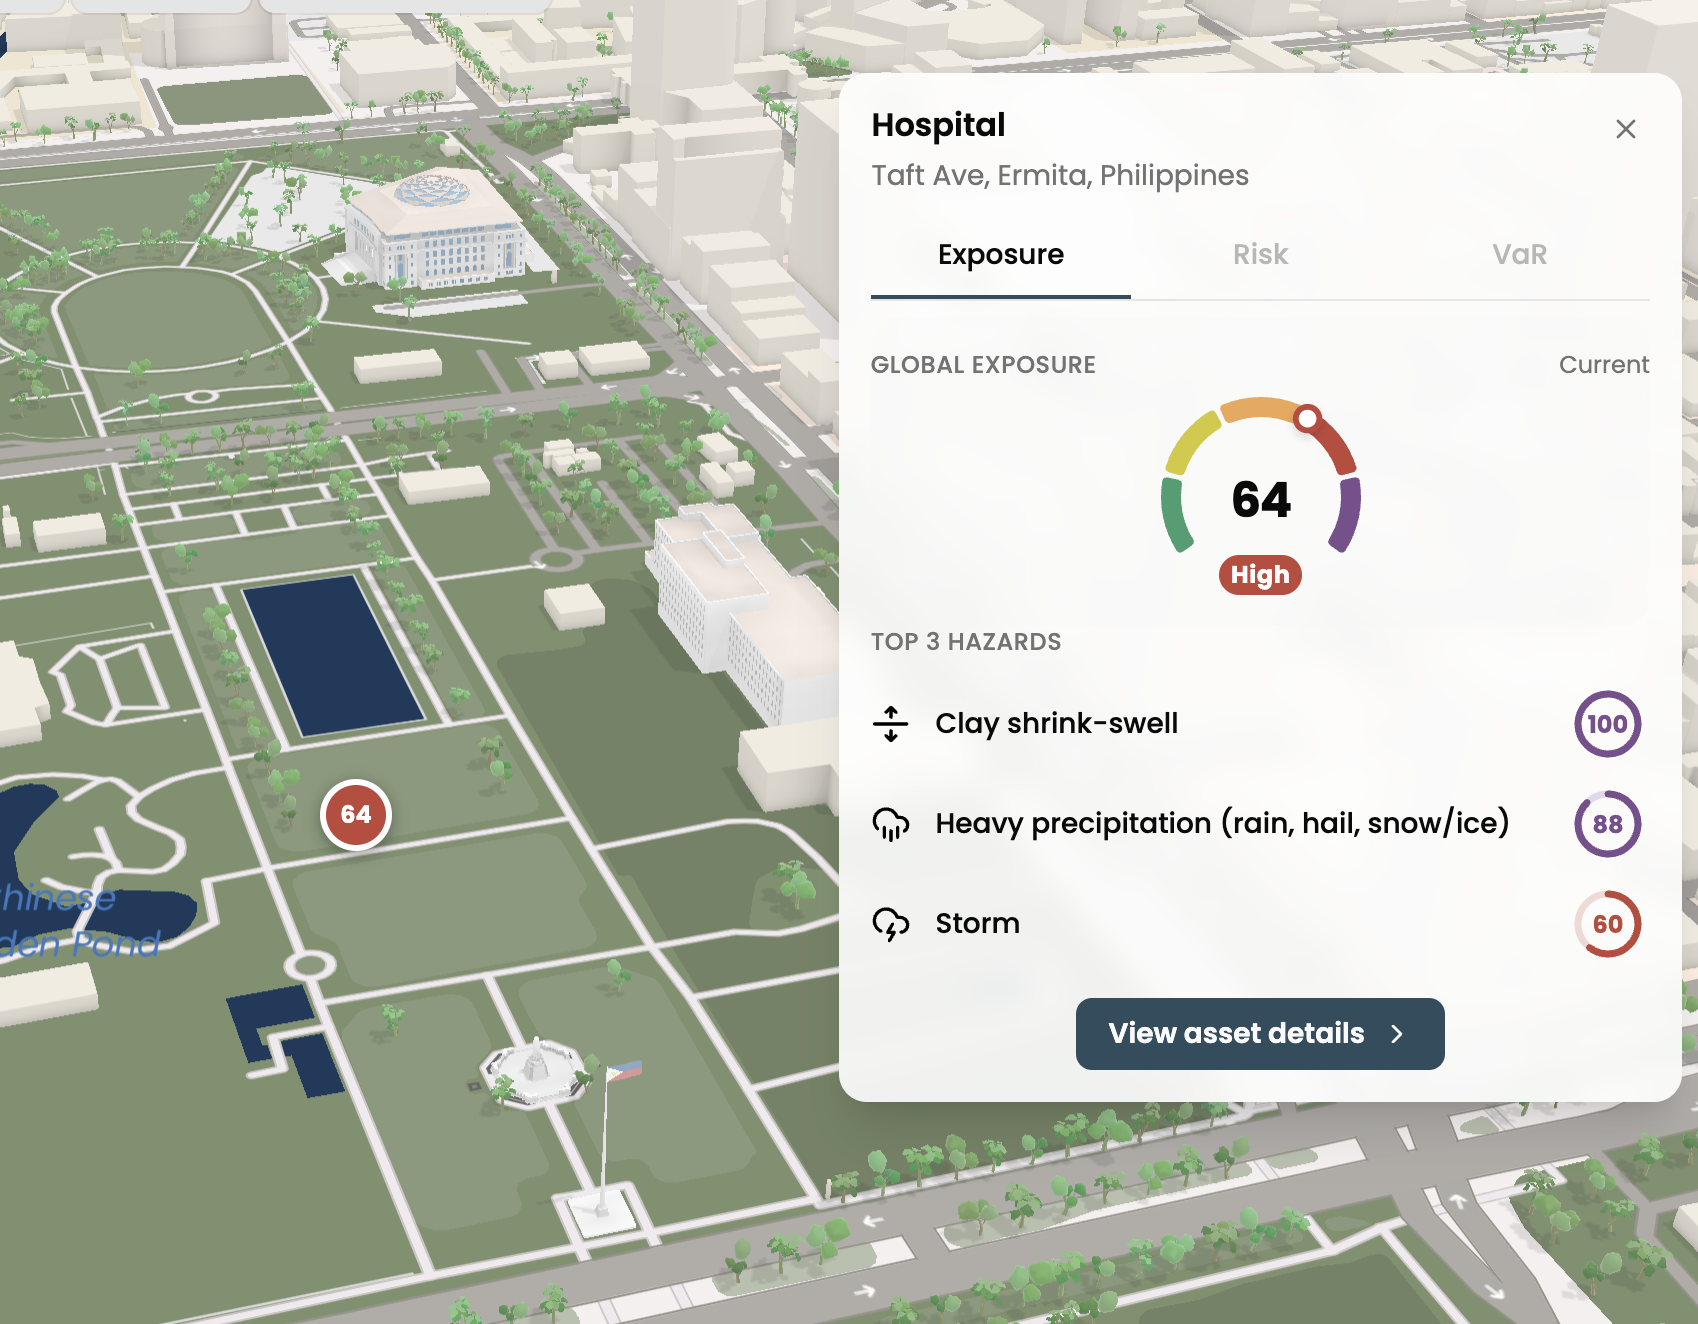
Assess your entire portfolio
What a site study produces for one asset, the platform produces for your whole portfolio: an exposure score across 32 chronic and acute hazards, on a scale that is comparable from one country to the next.
-
02
Weigh up several time horizons
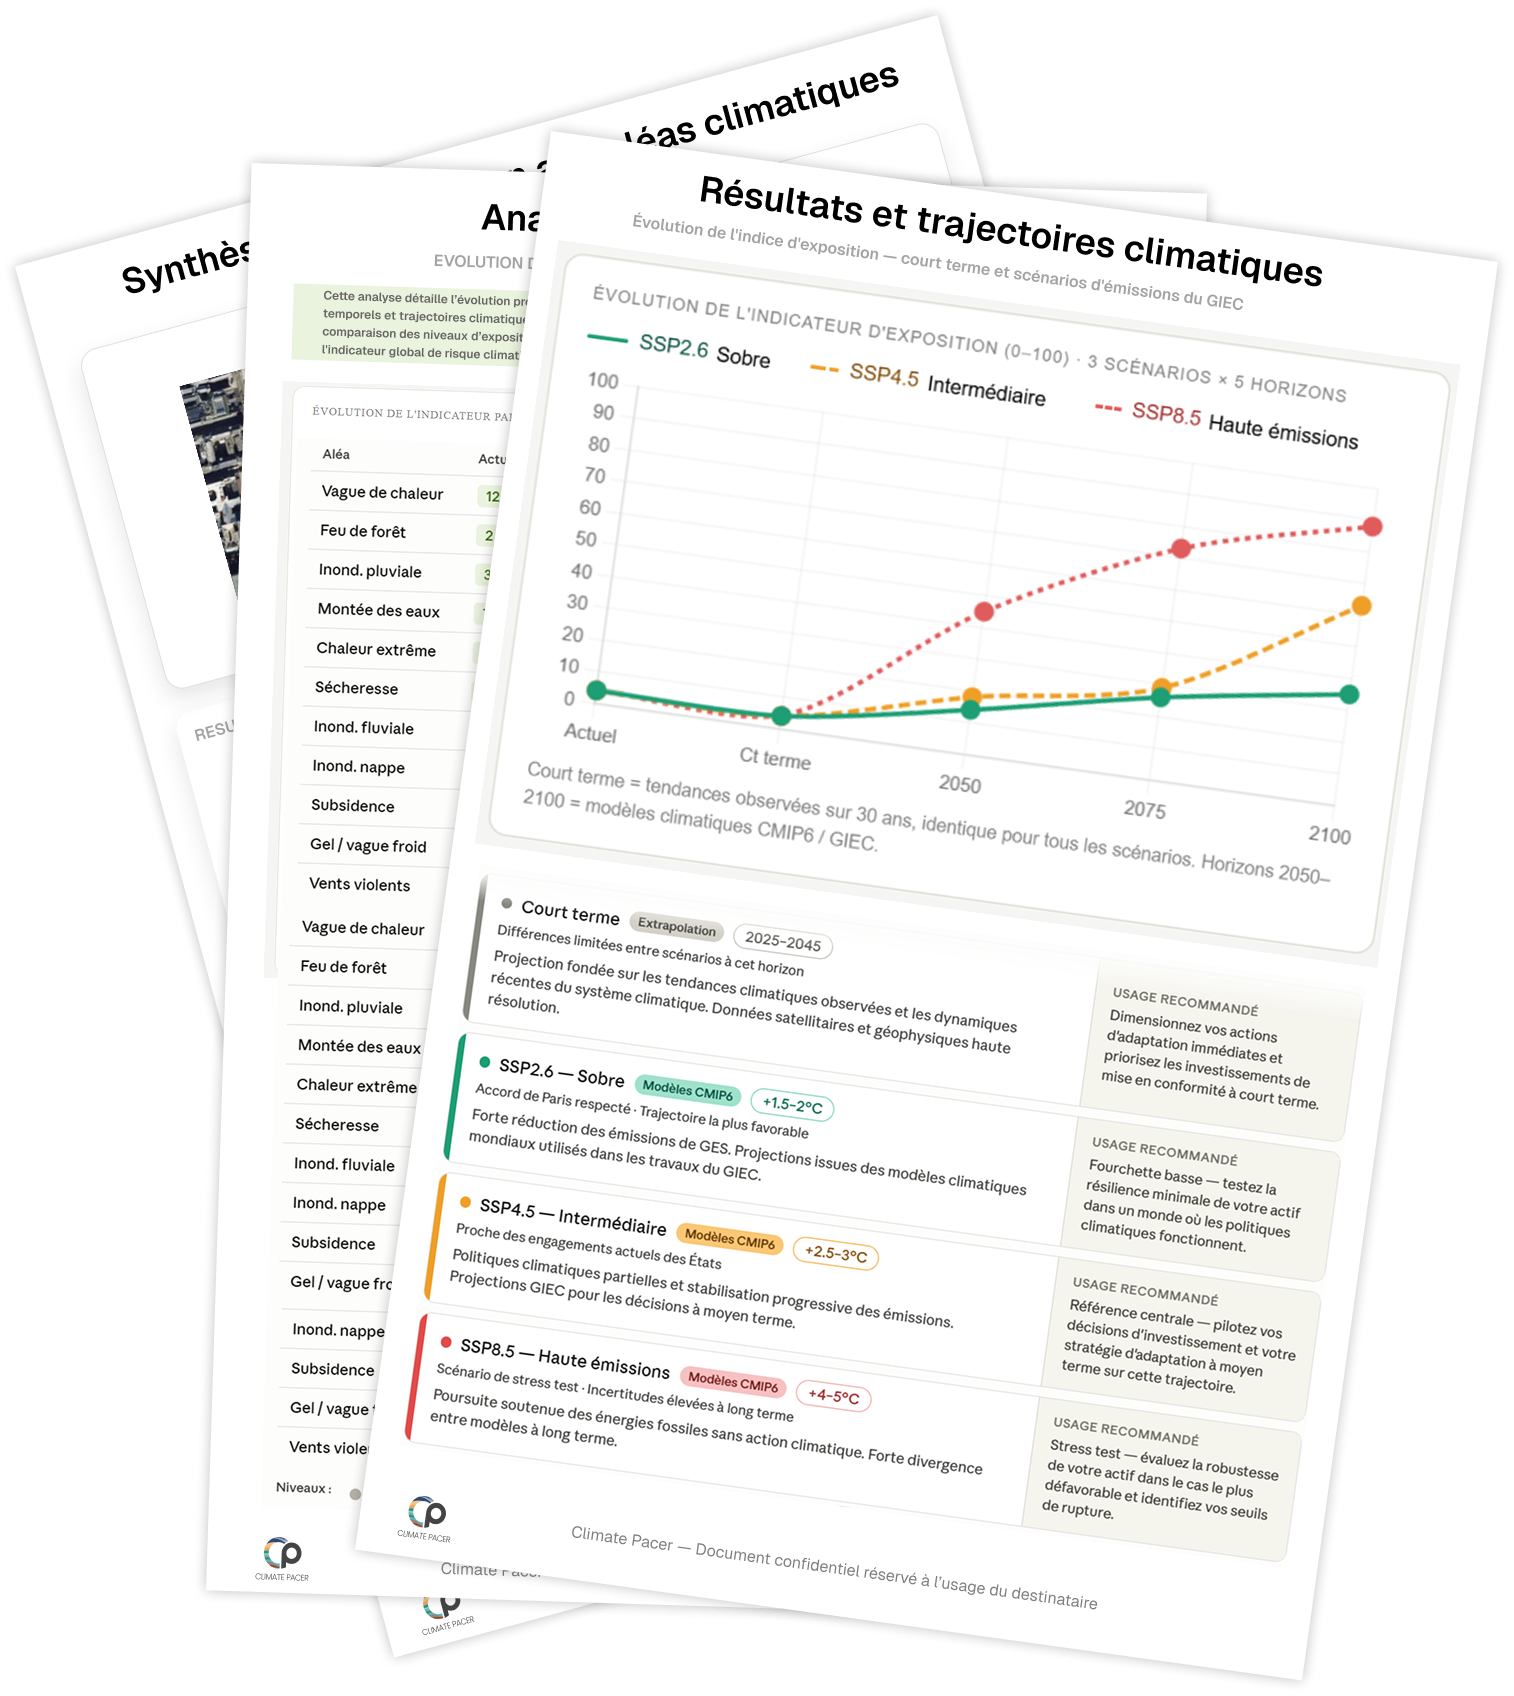
In the near term (20 years), our models downscale projections to asset level. Beyond that, IPCC scenarios take over through to 2100, so a decision can be anchored to the asset's actual holding period rather than an arbitrary horizon.
-
03
Deliver what is asked of you
Reports, data exports, API, access for your teams and your consultants. Every score stays traceable back to its source.
- Excel
- REST API
- Team access
Use cases
One exposure base, five business readings. These are the questions our users put to the platform.
Finance
Banks, insurers, asset managers
Physical risk that is poorly measured does not stay “extra-financial” for long: it ends up as damage, unplanned capex, rising premiums and a discount on value. Between 1980 and 2024, only a quarter of losses from natural catastrophes in Europe were insured (EIOPA). One base of 32 hazards screens collateral, holdings and counterparties, from screening through to stress tests, and feeds your CSRD, IFRS S2 and taxonomy disclosures.
- Which assets exceed the exposure threshold we have set ourselves?
- Does this collateral still hold at the maturity of the loan?
- For which assets will insurability become an issue before value does?
Real estate & construction
Investors, REITs, developers, contractors
Exposure is not an annex to due diligence: it is a variable that weighs on the acquisition price, capex, yield, insurability and exit value. It serves the screening of a pipeline, the choice of a site and the answer to a tender alike. Clay shrink-swell, flooding and urban heat are computed at plot level, down to 30 m resolution.
- Should we buy this building, and at what discount?
- Is this site compatible with the programme we have in mind?
- Which of these twelve sites gets the refurbishment budget?
Industry
Production sites, mining, energy, logistics
A site can stay intact and become unusable. In 2022, rainfall 51 % below normal deprived Sichuan of its hydropower and shut down more than 95 % of the province's aluminium capacity. Water stress on processes, heat on people and equipment, flooding on stock: every site is scored the same way, whether it sits in Gironde or in Vietnam.
- Which of our plants will run short of water first?
- Which sites concentrate the most hazards by 2050?
- Where do we need cooling, raising or redundancy?
Engineering
Engineering firms, design supervisors, infrastructure owners
Climate is a design input, not an environmental annex: foundations, deck, drainage and materials do not respond to the same hazards. Size for the structure's service life rather than the observed climate, with five horizons and three IPCC scenarios. Every score stays traceable back to its source, as an adaptation study under ISO 14091 requires.
- Which scenario should this structure be designed for?
- Which sections of the network is the average hiding from us?
- Where does this figure come from, and how do we justify it to the client?
Supply chains
Procurement, logistics, business continuity
A supply chain you cannot see is a supply chain you cannot secure. In 2024, the flooding of a single European aluminium site led a carmaker to cut its revenue guidance. Look for the single-source supplier in a critical area, or the hazard that hits several sites in the same basin at once: your tier 1 and 2, to the address, anywhere in the world.
- Which suppliers are located in a critical area?
- Which sites go down together if the same hazard strikes?
- Where do we need a second supplier, and in which region?
Why the question arises now.
Losses are rising, insurance is getting dearer, reporting is becoming mandatory: three pressures converging on the same data.
European companies covered by the new climate reporting obligations (CSRD) and by physical risk transparency requirements.
annual growth in insured losses. The cost of climate events keeps rising structurally.
in annual insured losses expected by 2030, according to Swiss Re. Faced with this rise, investors are tightening their climate resilience requirements.
Between complex climate data, regulatory requirements and investment decisions, organisations still lack the tools to turn this risk into action. Climate Pacer removes that barrier: a platform built to turn risk into concrete decisions.
Why Climate Pacer.
Methodological transparency
Sources, processing, formulas: every score is documented and traceable end to end.
Data precision
Combination and downscaling: from the grid of global climate models down to the scale of your asset.
Global coverage
Paris, Singapore or São Paulo: the same methodology, wherever your assets are.
Data management
Bring in your own data and combine it with the exposure indicators.
32 climate hazards
Acute and chronic, in 4 families aligned with the EU Green Taxonomy.
100 % EU, GDPR
Data hosted in Europe, GDPR compliant.
Let's map the climate exposure of your portfolio.
A tailored demo, on your own assets, with no commitment.
Request a demo
or email us:
contact@climatepacer.com
Nothing opened? No email application is associated with your browser. Copy the address above and write to us from your usual mail client.